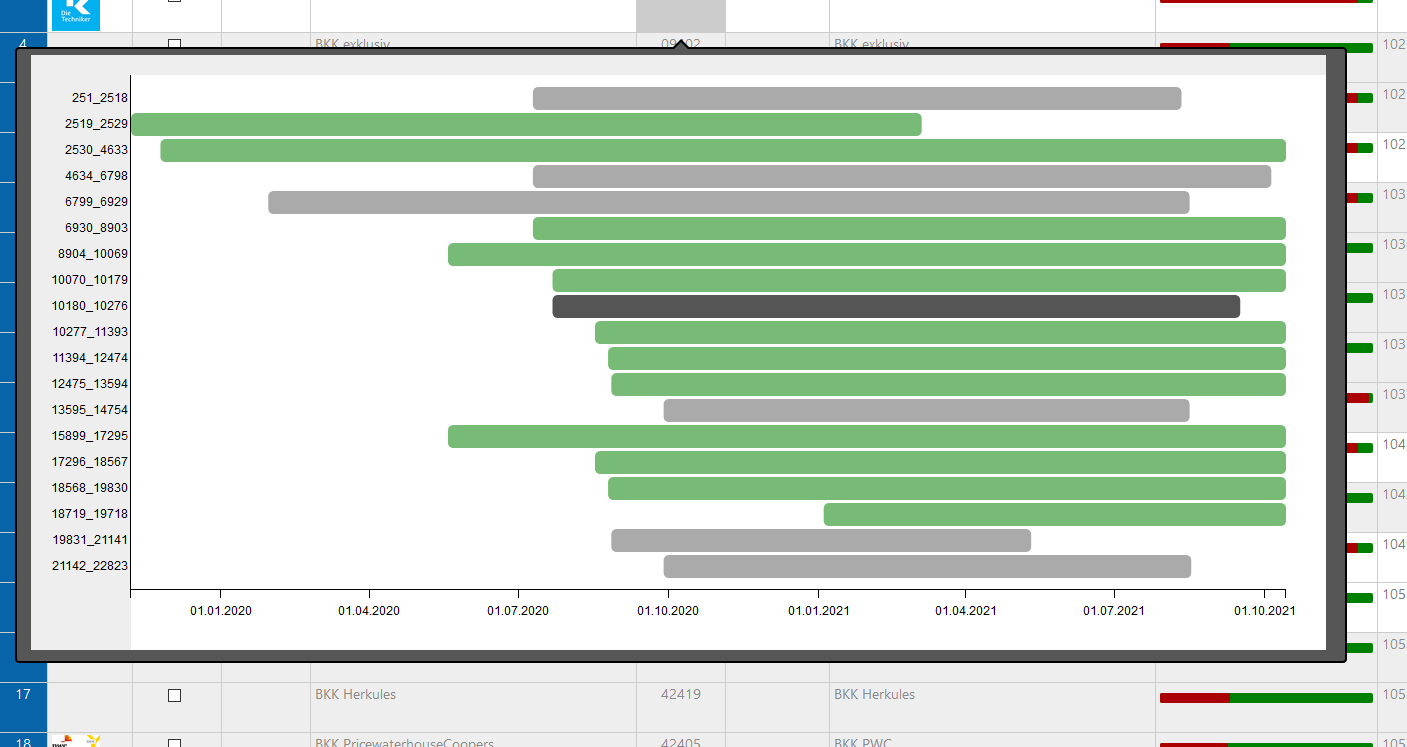
Here a screenshot. Next some code.
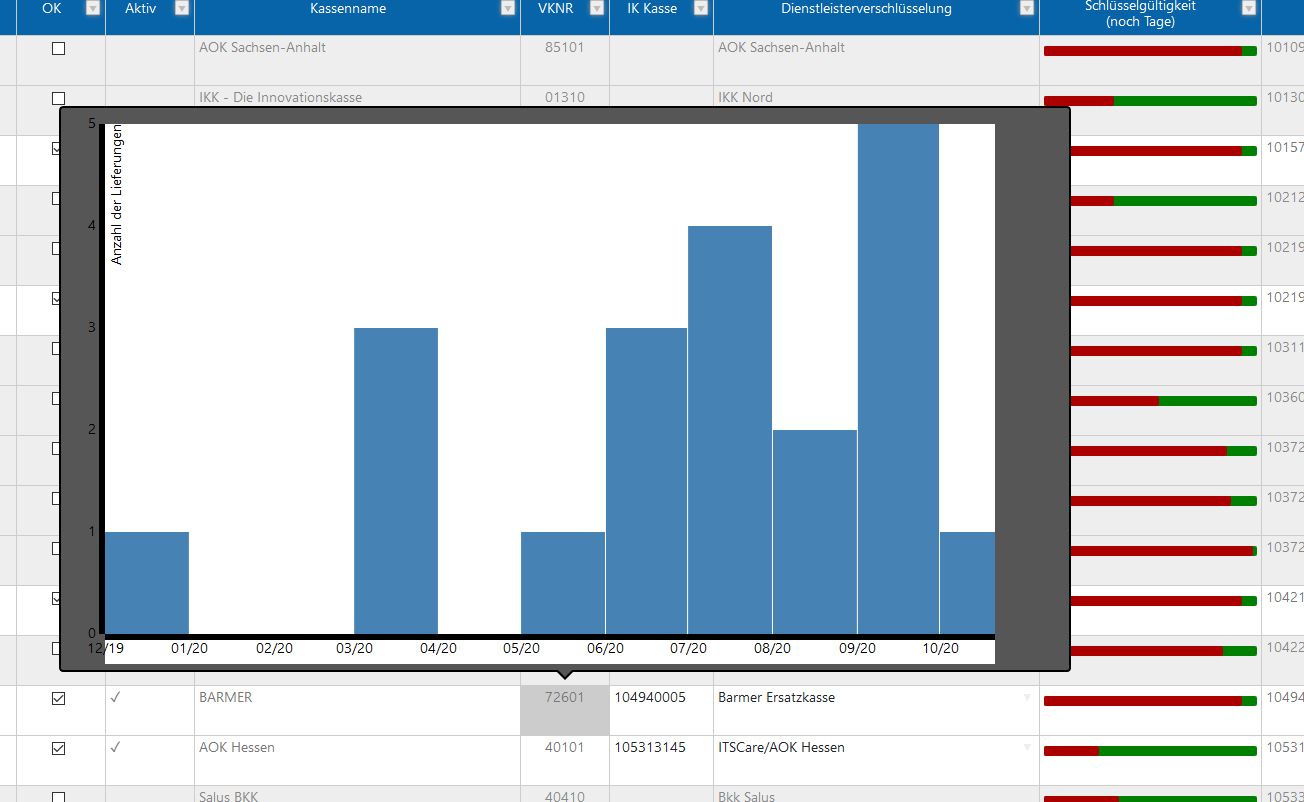
On mouseover on cell in a tooltipster a D3 graphic will rendered. Data comes by Ajax request.
Here a screenshot. Next some code.
That looks interesting! My last integration with charts and Handsontable was a couple of years ago with Chart.JS so I’m happy to see it working well with D3
I have still an issue with triggering of overlay.
Currently I’am using ‘afterOnCellMouseOver’-event but this not safe. First time no reaction the after second mouseover the layer appears. My goal is to place buttons into cell and after click on it …
Any samples?
Some hints:
 Handsontable.renderers.registerRenderer('gantt', GanttRenderer);
 Handsontable.cellTypes.registerCellType('gantt', {
        renderer: GanttRenderer,
        readOnly: true
    });
So it will called
 Columns : [{
            data: 'vknr', width: 96, type:'gantt'
        },]
And:
function GanttRenderer(instance, td, row, col, prop, value, cellProperties) {
        Handsontable.dom.empty(td);
        const div = document.createElement('DIV');
        div.className = 'thumbnail';
        const id = "gantt" + value;
        div.setAttribute('id', id);
        RenderGantt('#' + id,  '/Kassendienstleister/GetGanttData?vknr=' + value, 1200, 600)
        td.appendChild(div);
    }
For triggering of mouseover:
hot.addHook('afterOnCellMouseOver', (event, coords, td) => {
            if (hot.propToCol('vknr') == coords.col) {
                GanttOverlay(td, hot.getDataAtRowProp(coords.row, 'vknr'));
            }
});
Here the function for creating bubble:
function GanttOverlay(div, vknr) {
            const W = 1300, H = 600;
            var Div = $(div);
            Div.tooltipster({
                content: '<div id="zv' + vknr + '" style="width:' + W + 'px;height:' + H + 'px"></div>',
                contentAsHTML: true,
            }).tooltipster('show');
            RenderGantt('#zv' + vknr, settings.ZeitverlaufUrl + '?vknr=' + vknr, W, H)
        }
RenderGatt contains the wrapper logic:
function RenderGantt(_elem, _url, _width, _height) {
    d3.json(_url, function (error, tasks) {
    tasks.forEach(function (t) {
        t.startDate = new Date(t.startDate);
        t.endDate = new Date(t.endDate);
    });
    var taskStatus = {
        "IN": "bar-in",
        "OK": "bar-ok",
        "EX": "bar-ex"
    };
    var taskNames = tasks.map(function (t) { return t.taskName });
    tasks.sort(function (a, b) {
        return a.endDate - b.endDate;
    });
    tasks.sort(function (a, b) {
        return a.startDate - b.startDate;
    });
    var format = "%d.%m.%Y";
    var gantt = d3.gantt(_elem, _width, _height)
        .taskTypes(taskNames)
        .taskStatus(taskStatus)
        .tickFormat(format);
    gantt(tasks);
});
}
This calls the script from Dimitry Kudrayvtsev https://github.com/dk8996/Gantt-Chart
Hi @Knoeterich
how’s the project? It already looked interesting! I hope that everything works well.