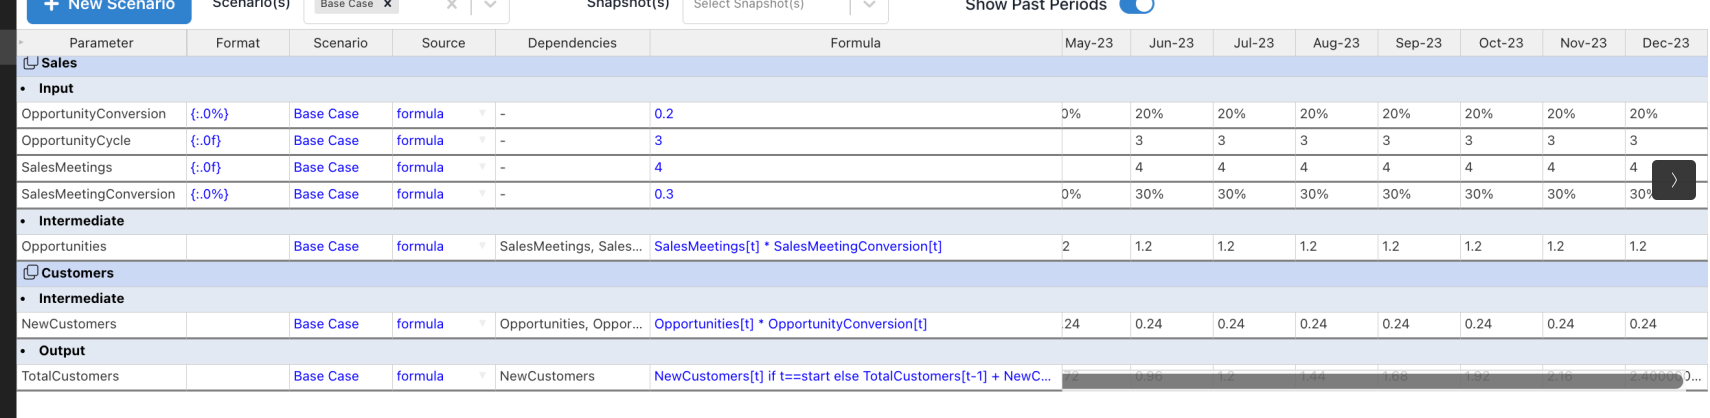
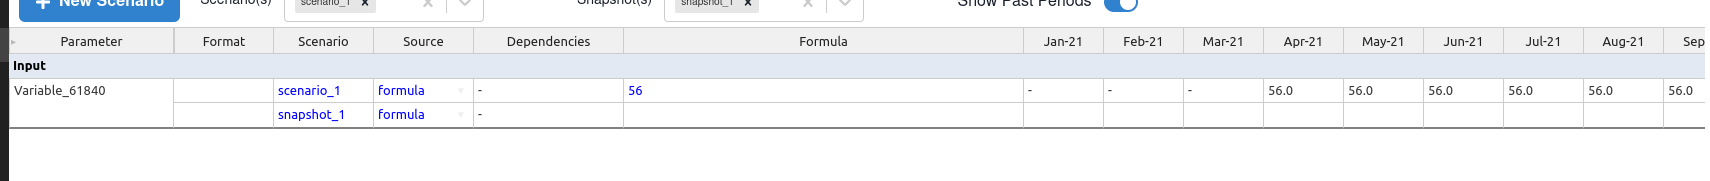
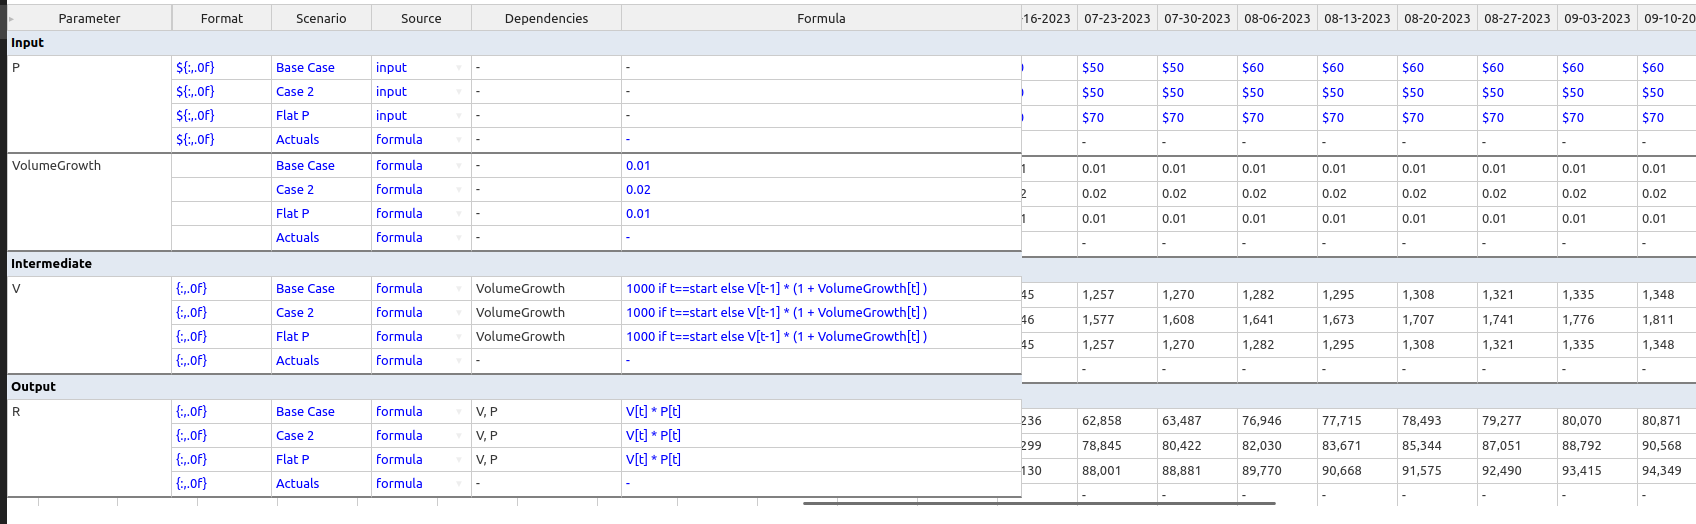
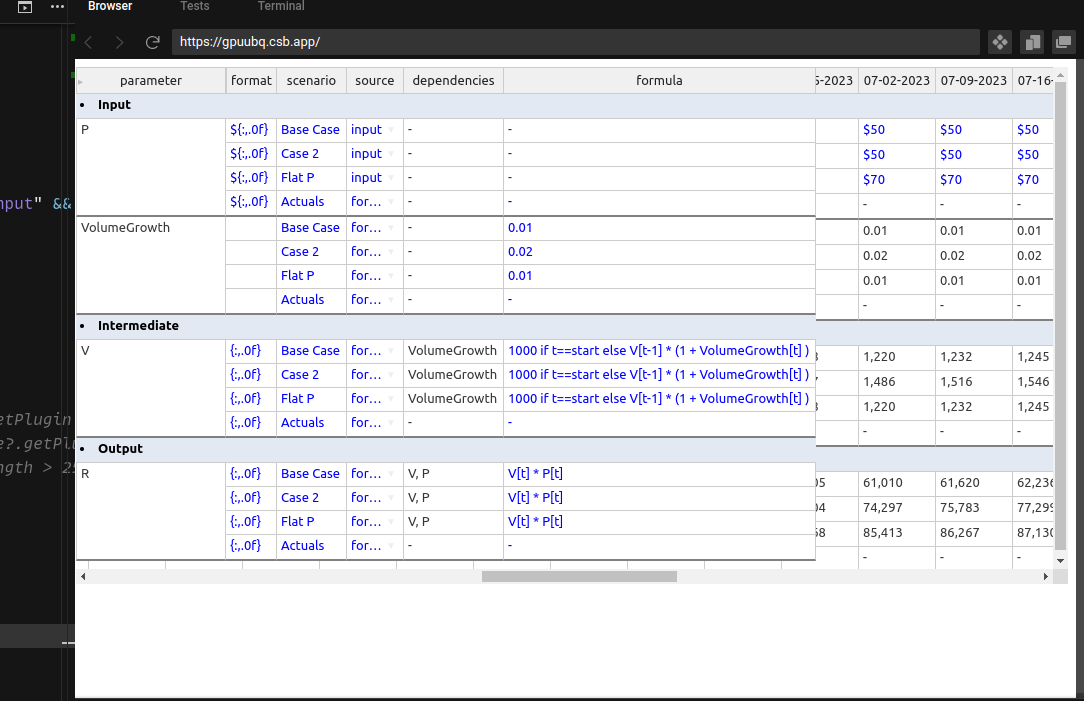
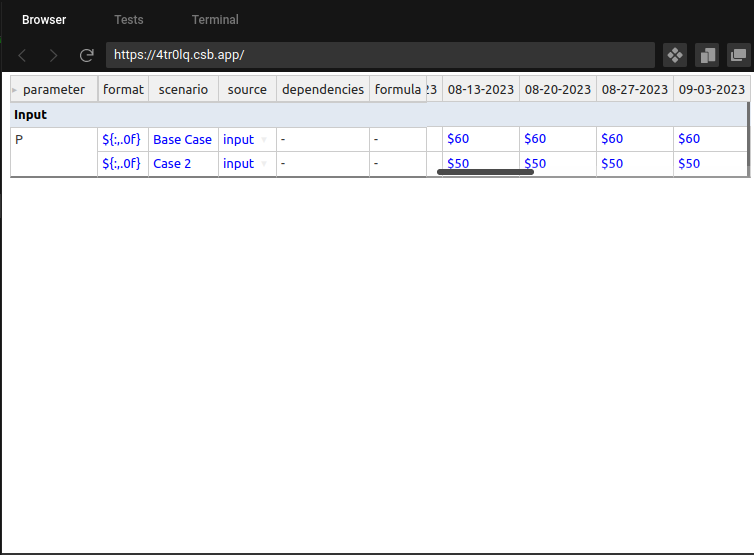
@adrian.szymanski also when I scroll to right, table height changes, and when I scroll back to left It snap backs to the heigh of fixed column side… this height changing issue is both in chrome and firefox…
can you make a demo with below data and determine where problem lies?
[
{
    "id": "node_type",
    "parameter": "<li>Input</li>",
    "format": null,
    "scenario": null,
    "source": null,
    "dependencies": null,
    "formula": null,
    "01-01-2023": "",
    "01-08-2023": "",
    "01-15-2023": "",
    "01-22-2023": "",
    "01-29-2023": "",
    "02-05-2023": "",
    "02-12-2023": "",
    "02-19-2023": "",
    "02-26-2023": "",
    "03-05-2023": "",
    "03-12-2023": "",
    "03-19-2023": "",
    "03-26-2023": "",
    "04-02-2023": "",
    "04-09-2023": "",
    "04-16-2023": "",
    "04-23-2023": "",
    "04-30-2023": "",
    "05-07-2023": "",
    "05-14-2023": "",
    "05-21-2023": "",
    "05-28-2023": "",
    "06-04-2023": "",
    "06-11-2023": "",
    "06-18-2023": "",
    "06-25-2023": "",
    "07-02-2023": "",
    "07-09-2023": "",
    "07-16-2023": "",
    "07-23-2023": "",
    "07-30-2023": "",
    "08-06-2023": "",
    "08-13-2023": "",
    "08-20-2023": "",
    "08-27-2023": "",
    "09-03-2023": "",
    "09-10-2023": "",
    "09-17-2023": "",
    "09-24-2023": "",
    "10-01-2023": "",
    "10-08-2023": "",
    "10-15-2023": "",
    "10-22-2023": "",
    "10-29-2023": "",
    "11-05-2023": "",
    "11-12-2023": "",
    "11-19-2023": "",
    "11-26-2023": "",
    "12-03-2023": "",
    "12-10-2023": "",
    "12-17-2023": "",
    "12-24-2023": ""
},
{
    "id": "Variable-83208",
    "parameter": "P",
    "format": "${:,.0f}",
    "source": "input",
    "scenario": "Base Case",
    "dependencies": "-",
    "formula": "90",
    "01-01-2023": "-",
    "01-08-2023": "-",
    "01-15-2023": "-",
    "01-22-2023": "-",
    "01-29-2023": "-",
    "02-05-2023": "-",
    "02-12-2023": "$30",
    "02-19-2023": "$30",
    "02-26-2023": "$30",
    "03-05-2023": "$30",
    "03-12-2023": "$30",
    "03-19-2023": "$30",
    "03-26-2023": "$30",
    "04-02-2023": "$30",
    "04-09-2023": "$30",
    "04-16-2023": "$30",
    "04-23-2023": "$20",
    "04-30-2023": "$20",
    "05-07-2023": "$30",
    "05-14-2023": "$30",
    "05-21-2023": "$30",
    "05-28-2023": "$30",
    "06-04-2023": "$30",
    "06-11-2023": "$30",
    "06-18-2023": "$30",
    "06-25-2023": "$50",
    "07-02-2023": "$50",
    "07-09-2023": "$50",
    "07-16-2023": "$50",
    "07-23-2023": "$50",
    "07-30-2023": "$50",
    "08-06-2023": "$60",
    "08-13-2023": "$60",
    "08-20-2023": "$60",
    "08-27-2023": "$60",
    "09-03-2023": "$60",
    "09-10-2023": "$60",
    "09-17-2023": "$60",
    "09-24-2023": "$60",
    "10-01-2023": "$70",
    "10-08-2023": "$70",
    "10-15-2023": "$70",
    "10-22-2023": "$70",
    "10-29-2023": "$70",
    "11-05-2023": "$70",
    "11-12-2023": "$70",
    "11-19-2023": "$80",
    "11-26-2023": "$80",
    "12-03-2023": "$80",
    "12-10-2023": "$80",
    "12-17-2023": "$80",
    "12-24-2023": "$80"
},
{
    "id": "Variable-83208",
    "parameter": "P",
    "format": "${:,.0f}",
    "source": "input",
    "scenario": "Case 2",
    "dependencies": "-",
    "formula": "90",
    "01-01-2023": "-",
    "01-08-2023": "-",
    "01-15-2023": "-",
    "01-22-2023": "-",
    "01-29-2023": "-",
    "02-05-2023": "-",
    "02-12-2023": "$20",
    "02-19-2023": "$20",
    "02-26-2023": "$20",
    "03-05-2023": "$20",
    "03-12-2023": "$20",
    "03-19-2023": "$20",
    "03-26-2023": "$30",
    "04-02-2023": "$30",
    "04-09-2023": "$30",
    "04-16-2023": "$30",
    "04-23-2023": "$30",
    "04-30-2023": "$30",
    "05-07-2023": "$30",
    "05-14-2023": "$30",
    "05-21-2023": "$30",
    "05-28-2023": "$30",
    "06-04-2023": "$30",
    "06-11-2023": "$30",
    "06-18-2023": "$30",
    "06-25-2023": "$30",
    "07-02-2023": "$50",
    "07-09-2023": "$50",
    "07-16-2023": "$50",
    "07-23-2023": "$50",
    "07-30-2023": "$50",
    "08-06-2023": "$50",
    "08-13-2023": "$50",
    "08-20-2023": "$50",
    "08-27-2023": "$50",
    "09-03-2023": "$50",
    "09-10-2023": "$50",
    "09-17-2023": "$50",
    "09-24-2023": "$50",
    "10-01-2023": "$50",
    "10-08-2023": "$50",
    "10-15-2023": "$50",
    "10-22-2023": "$50",
    "10-29-2023": "$50",
    "11-05-2023": "$20",
    "11-12-2023": "$20",
    "11-19-2023": "$20",
    "11-26-2023": "$20",
    "12-03-2023": "$20",
    "12-10-2023": "$20",
    "12-17-2023": "$20",
    "12-24-2023": "$20"
},
{
    "id": "Variable-83208",
    "parameter": "P",
    "format": "${:,.0f}",
    "source": "input",
    "scenario": "Flat P",
    "dependencies": "-",
    "formula": "90",
    "01-01-2023": "-",
    "01-08-2023": "-",
    "01-15-2023": "-",
    "01-22-2023": "-",
    "01-29-2023": "-",
    "02-05-2023": "-",
    "02-12-2023": "$70",
    "02-19-2023": "$70",
    "02-26-2023": "$70",
    "03-05-2023": "$70",
    "03-12-2023": "$70",
    "03-19-2023": "$70",
    "03-26-2023": "$70",
    "04-02-2023": "$70",
    "04-09-2023": "$70",
    "04-16-2023": "$70",
    "04-23-2023": "$70",
    "04-30-2023": "$70",
    "05-07-2023": "$70",
    "05-14-2023": "$70",
    "05-21-2023": "$70",
    "05-28-2023": "$70",
    "06-04-2023": "$70",
    "06-11-2023": "$70",
    "06-18-2023": "$70",
    "06-25-2023": "$70",
    "07-02-2023": "$70",
    "07-09-2023": "$70",
    "07-16-2023": "$70",
    "07-23-2023": "$70",
    "07-30-2023": "$70",
    "08-06-2023": "$70",
    "08-13-2023": "$70",
    "08-20-2023": "$70",
    "08-27-2023": "$70",
    "09-03-2023": "$70",
    "09-10-2023": "$70",
    "09-17-2023": "$70",
    "09-24-2023": "$70",
    "10-01-2023": "$70",
    "10-08-2023": "$70",
    "10-15-2023": "$70",
    "10-22-2023": "$70",
    "10-29-2023": "$70",
    "11-05-2023": "$70",
    "11-12-2023": "$70",
    "11-19-2023": "$70",
    "11-26-2023": "$70",
    "12-03-2023": "$70",
    "12-10-2023": "$70",
    "12-17-2023": "$70",
    "12-24-2023": "$70"
},
{
    "id": "Variable-83208",
    "parameter": "P",
    "format": "${:,.0f}",
    "source": "formula",
    "scenario": "Actuals",
    "dependencies": "-",
    "formula": "-",
    "01-01-2023": "-",
    "01-08-2023": "-",
    "01-15-2023": "-",
    "01-22-2023": "-",
    "01-29-2023": "-",
    "02-05-2023": "-",
    "02-12-2023": "-",
    "02-19-2023": "-",
    "02-26-2023": "-",
    "03-05-2023": "-",
    "03-12-2023": "-",
    "03-19-2023": "-",
    "03-26-2023": "-",
    "04-02-2023": "-",
    "04-09-2023": "-",
    "04-16-2023": "-",
    "04-23-2023": "-",
    "04-30-2023": "-",
    "05-07-2023": "-",
    "05-14-2023": "-",
    "05-21-2023": "-",
    "05-28-2023": "-",
    "06-04-2023": "-",
    "06-11-2023": "-",
    "06-18-2023": "-",
    "06-25-2023": "-",
    "07-02-2023": "-",
    "07-09-2023": "-",
    "07-16-2023": "-",
    "07-23-2023": "-",
    "07-30-2023": "-",
    "08-06-2023": "-",
    "08-13-2023": "-",
    "08-20-2023": "-",
    "08-27-2023": "-",
    "09-03-2023": "-",
    "09-10-2023": "-",
    "09-17-2023": "-",
    "09-24-2023": "-",
    "10-01-2023": "-",
    "10-08-2023": "-",
    "10-15-2023": "-",
    "10-22-2023": "-",
    "10-29-2023": "-",
    "11-05-2023": "-",
    "11-12-2023": "-",
    "11-19-2023": "-",
    "11-26-2023": "-",
    "12-03-2023": "-",
    "12-10-2023": "-",
    "12-17-2023": "-",
    "12-24-2023": "-"
},
{
    "id": "Variable-71152",
    "parameter": "VolumeGrowth",
    "format": "",
    "source": "formula",
    "scenario": "Base Case",
    "dependencies": "-",
    "formula": "0.01",
    "01-01-2023": "-",
    "01-08-2023": "-",
    "01-15-2023": "-",
    "01-22-2023": "-",
    "01-29-2023": "-",
    "02-05-2023": "-",
    "02-12-2023": "0.01",
    "02-19-2023": "0.01",
    "02-26-2023": "0.01",
    "03-05-2023": "0.01",
    "03-12-2023": "0.01",
    "03-19-2023": "0.01",
    "03-26-2023": "0.01",
    "04-02-2023": "0.01",
    "04-09-2023": "0.01",
    "04-16-2023": "0.01",
    "04-23-2023": "0.01",
    "04-30-2023": "0.01",
    "05-07-2023": "0.01",
    "05-14-2023": "0.01",
    "05-21-2023": "0.01",
    "05-28-2023": "0.01",
    "06-04-2023": "0.01",
    "06-11-2023": "0.01",
    "06-18-2023": "0.01",
    "06-25-2023": "0.01",
    "07-02-2023": "0.01",
    "07-09-2023": "0.01",
    "07-16-2023": "0.01",
    "07-23-2023": "0.01",
    "07-30-2023": "0.01",
    "08-06-2023": "0.01",
    "08-13-2023": "0.01",
    "08-20-2023": "0.01",
    "08-27-2023": "0.01",
    "09-03-2023": "0.01",
    "09-10-2023": "0.01",
    "09-17-2023": "0.01",
    "09-24-2023": "0.01",
    "10-01-2023": "0.01",
    "10-08-2023": "0.01",
    "10-15-2023": "0.01",
    "10-22-2023": "0.01",
    "10-29-2023": "0.01",
    "11-05-2023": "0.01",
    "11-12-2023": "0.01",
    "11-19-2023": "0.01",
    "11-26-2023": "0.01",
    "12-03-2023": "0.01",
    "12-10-2023": "0.01",
    "12-17-2023": "0.01",
    "12-24-2023": "0.01"
},
{
    "id": "Variable-71152",
    "parameter": "VolumeGrowth",
    "format": "",
    "source": "formula",
    "scenario": "Case 2",
    "dependencies": "-",
    "formula": "0.02",
    "01-01-2023": "-",
    "01-08-2023": "-",
    "01-15-2023": "-",
    "01-22-2023": "-",
    "01-29-2023": "-",
    "02-05-2023": "-",
    "02-12-2023": "0.02",
    "02-19-2023": "0.02",
    "02-26-2023": "0.02",
    "03-05-2023": "0.02",
    "03-12-2023": "0.02",
    "03-19-2023": "0.02",
    "03-26-2023": "0.02",
    "04-02-2023": "0.02",
    "04-09-2023": "0.02",
    "04-16-2023": "0.02",
    "04-23-2023": "0.02",
    "04-30-2023": "0.02",
    "05-07-2023": "0.02",
    "05-14-2023": "0.02",
    "05-21-2023": "0.02",
    "05-28-2023": "0.02",
    "06-04-2023": "0.02",
    "06-11-2023": "0.02",
    "06-18-2023": "0.02",
    "06-25-2023": "0.02",
    "07-02-2023": "0.02",
    "07-09-2023": "0.02",
    "07-16-2023": "0.02",
    "07-23-2023": "0.02",
    "07-30-2023": "0.02",
    "08-06-2023": "0.02",
    "08-13-2023": "0.02",
    "08-20-2023": "0.02",
    "08-27-2023": "0.02",
    "09-03-2023": "0.02",
    "09-10-2023": "0.02",
    "09-17-2023": "0.02",
    "09-24-2023": "0.02",
    "10-01-2023": "0.02",
    "10-08-2023": "0.02",
    "10-15-2023": "0.02",
    "10-22-2023": "0.02",
    "10-29-2023": "0.02",
    "11-05-2023": "0.02",
    "11-12-2023": "0.02",
    "11-19-2023": "0.02",
    "11-26-2023": "0.02",
    "12-03-2023": "0.02",
    "12-10-2023": "0.02",
    "12-17-2023": "0.02",
    "12-24-2023": "0.02"
},
{
    "id": "Variable-71152",
    "parameter": "VolumeGrowth",
    "format": "",
    "source": "formula",
    "scenario": "Flat P",
    "dependencies": "-",
    "formula": "0.01",
    "01-01-2023": "-",
    "01-08-2023": "-",
    "01-15-2023": "-",
    "01-22-2023": "-",
    "01-29-2023": "-",
    "02-05-2023": "-",
    "02-12-2023": "0.01",
    "02-19-2023": "0.01",
    "02-26-2023": "0.01",
    "03-05-2023": "0.01",
    "03-12-2023": "0.01",
    "03-19-2023": "0.01",
    "03-26-2023": "0.01",
    "04-02-2023": "0.01",
    "04-09-2023": "0.01",
    "04-16-2023": "0.01",
    "04-23-2023": "0.01",
    "04-30-2023": "0.01",
    "05-07-2023": "0.01",
    "05-14-2023": "0.01",
    "05-21-2023": "0.01",
    "05-28-2023": "0.01",
    "06-04-2023": "0.01",
    "06-11-2023": "0.01",
    "06-18-2023": "0.01",
    "06-25-2023": "0.01",
    "07-02-2023": "0.01",
    "07-09-2023": "0.01",
    "07-16-2023": "0.01",
    "07-23-2023": "0.01",
    "07-30-2023": "0.01",
    "08-06-2023": "0.01",
    "08-13-2023": "0.01",
    "08-20-2023": "0.01",
    "08-27-2023": "0.01",
    "09-03-2023": "0.01",
    "09-10-2023": "0.01",
    "09-17-2023": "0.01",
    "09-24-2023": "0.01",
    "10-01-2023": "0.01",
    "10-08-2023": "0.01",
    "10-15-2023": "0.01",
    "10-22-2023": "0.01",
    "10-29-2023": "0.01",
    "11-05-2023": "0.01",
    "11-12-2023": "0.01",
    "11-19-2023": "0.01",
    "11-26-2023": "0.01",
    "12-03-2023": "0.01",
    "12-10-2023": "0.01",
    "12-17-2023": "0.01",
    "12-24-2023": "0.01"
},
{
    "id": "Variable-71152",
    "parameter": "VolumeGrowth",
    "format": "",
    "source": "formula",
    "scenario": "Actuals",
    "dependencies": "-",
    "formula": "-",
    "01-01-2023": "-",
    "01-08-2023": "-",
    "01-15-2023": "-",
    "01-22-2023": "-",
    "01-29-2023": "-",
    "02-05-2023": "-",
    "02-12-2023": "-",
    "02-19-2023": "-",
    "02-26-2023": "-",
    "03-05-2023": "-",
    "03-12-2023": "-",
    "03-19-2023": "-",
    "03-26-2023": "-",
    "04-02-2023": "-",
    "04-09-2023": "-",
    "04-16-2023": "-",
    "04-23-2023": "-",
    "04-30-2023": "-",
    "05-07-2023": "-",
    "05-14-2023": "-",
    "05-21-2023": "-",
    "05-28-2023": "-",
    "06-04-2023": "-",
    "06-11-2023": "-",
    "06-18-2023": "-",
    "06-25-2023": "-",
    "07-02-2023": "-",
    "07-09-2023": "-",
    "07-16-2023": "-",
    "07-23-2023": "-",
    "07-30-2023": "-",
    "08-06-2023": "-",
    "08-13-2023": "-",
    "08-20-2023": "-",
    "08-27-2023": "-",
    "09-03-2023": "-",
    "09-10-2023": "-",
    "09-17-2023": "-",
    "09-24-2023": "-",
    "10-01-2023": "-",
    "10-08-2023": "-",
    "10-15-2023": "-",
    "10-22-2023": "-",
    "10-29-2023": "-",
    "11-05-2023": "-",
    "11-12-2023": "-",
    "11-19-2023": "-",
    "11-26-2023": "-",
    "12-03-2023": "-",
    "12-10-2023": "-",
    "12-17-2023": "-",
    "12-24-2023": "-"
},
{
    "id": "node_type",
    "parameter": "<li>Intermediate</li>",
    "format": null,
    "scenario": null,
    "source": null,
    "dependencies": null,
    "formula": null,
    "01-01-2023": "",
    "01-08-2023": "",
    "01-15-2023": "",
    "01-22-2023": "",
    "01-29-2023": "",
    "02-05-2023": "",
    "02-12-2023": "",
    "02-19-2023": "",
    "02-26-2023": "",
    "03-05-2023": "",
    "03-12-2023": "",
    "03-19-2023": "",
    "03-26-2023": "",
    "04-02-2023": "",
    "04-09-2023": "",
    "04-16-2023": "",
    "04-23-2023": "",
    "04-30-2023": "",
    "05-07-2023": "",
    "05-14-2023": "",
    "05-21-2023": "",
    "05-28-2023": "",
    "06-04-2023": "",
    "06-11-2023": "",
    "06-18-2023": "",
    "06-25-2023": "",
    "07-02-2023": "",
    "07-09-2023": "",
    "07-16-2023": "",
    "07-23-2023": "",
    "07-30-2023": "",
    "08-06-2023": "",
    "08-13-2023": "",
    "08-20-2023": "",
    "08-27-2023": "",
    "09-03-2023": "",
    "09-10-2023": "",
    "09-17-2023": "",
    "09-24-2023": "",
    "10-01-2023": "",
    "10-08-2023": "",
    "10-15-2023": "",
    "10-22-2023": "",
    "10-29-2023": "",
    "11-05-2023": "",
    "11-12-2023": "",
    "11-19-2023": "",
    "11-26-2023": "",
    "12-03-2023": "",
    "12-10-2023": "",
    "12-17-2023": "",
    "12-24-2023": ""
},
{
    "id": "Flow-22737",
    "parameter": "V",
    "format": "{:,.0f}",
    "source": "formula",
    "scenario": "Base Case",
    "dependencies": "VolumeGrowth",
    "formula": "1000 if t==start else V[t-1] * (1 + VolumeGrowth[t] )",
    "01-01-2023": "-",
    "01-08-2023": "-",
    "01-15-2023": "-",
    "01-22-2023": "-",
    "01-29-2023": "-",
    "02-05-2023": "-",
    "02-12-2023": "1,000",
    "02-19-2023": "1,010",
    "02-26-2023": "1,020",
    "03-05-2023": "1,030",
    "03-12-2023": "1,041",
    "03-19-2023": "1,051",
    "03-26-2023": "1,062",
    "04-02-2023": "1,072",
    "04-09-2023": "1,083",
    "04-16-2023": "1,094",
    "04-23-2023": "1,105",
    "04-30-2023": "1,116",
    "05-07-2023": "1,127",
    "05-14-2023": "1,138",
    "05-21-2023": "1,149",
    "05-28-2023": "1,161",
    "06-04-2023": "1,173",
    "06-11-2023": "1,184",
    "06-18-2023": "1,196",
    "06-25-2023": "1,208",
    "07-02-2023": "1,220",
    "07-09-2023": "1,232",
    "07-16-2023": "1,245",
    "07-23-2023": "1,257",
    "07-30-2023": "1,270",
    "08-06-2023": "1,282",
    "08-13-2023": "1,295",
    "08-20-2023": "1,308",
    "08-27-2023": "1,321",
    "09-03-2023": "1,335",
    "09-10-2023": "1,348",
    "09-17-2023": "1,361",
    "09-24-2023": "1,375",
    "10-01-2023": "1,389",
    "10-08-2023": "1,403",
    "10-15-2023": "1,417",
    "10-22-2023": "1,431",
    "10-29-2023": "1,445",
    "11-05-2023": "1,460",
    "11-12-2023": "1,474",
    "11-19-2023": "1,489",
    "11-26-2023": "1,504",
    "12-03-2023": "1,519",
    "12-10-2023": "1,534",
    "12-17-2023": "1,549",
    "12-24-2023": "1,565"
},
{
    "id": "Flow-22737",
    "parameter": "V",
    "format": "{:,.0f}",
    "source": "formula",
    "scenario": "Case 2",
    "dependencies": "VolumeGrowth",
    "formula": "1000 if t==start else V[t-1] * (1 + VolumeGrowth[t] )",
    "01-01-2023": "-",
    "01-08-2023": "-",
    "01-15-2023": "-",
    "01-22-2023": "-",
    "01-29-2023": "-",
    "02-05-2023": "-",
    "02-12-2023": "1,000",
    "02-19-2023": "1,020",
    "02-26-2023": "1,040",
    "03-05-2023": "1,061",
    "03-12-2023": "1,082",
    "03-19-2023": "1,104",
    "03-26-2023": "1,126",
    "04-02-2023": "1,149",
    "04-09-2023": "1,172",
    "04-16-2023": "1,195",
    "04-23-2023": "1,219",
    "04-30-2023": "1,243",
    "05-07-2023": "1,268",
    "05-14-2023": "1,294",
    "05-21-2023": "1,319",
    "05-28-2023": "1,346",
    "06-04-2023": "1,373",
    "06-11-2023": "1,400",
    "06-18-2023": "1,428",
    "06-25-2023": "1,457",
    "07-02-2023": "1,486",
    "07-09-2023": "1,516",
    "07-16-2023": "1,546",
    "07-23-2023": "1,577",
    "07-30-2023": "1,608",
    "08-06-2023": "1,641",
    "08-13-2023": "1,673",
    "08-20-2023": "1,707",
    "08-27-2023": "1,741",
    "09-03-2023": "1,776",
    "09-10-2023": "1,811",
    "09-17-2023": "1,848",
    "09-24-2023": "1,885",
    "10-01-2023": "1,922",
    "10-08-2023": "1,961",
    "10-15-2023": "2,000",
    "10-22-2023": "2,040",
    "10-29-2023": "2,081",
    "11-05-2023": "2,122",
    "11-12-2023": "2,165",
    "11-19-2023": "2,208",
    "11-26-2023": "2,252",
    "12-03-2023": "2,297",
    "12-10-2023": "2,343",
    "12-17-2023": "2,390",
    "12-24-2023": "2,438"
},
{
    "id": "Flow-22737",
    "parameter": "V",
    "format": "{:,.0f}",
    "source": "formula",
    "scenario": "Flat P",
    "dependencies": "VolumeGrowth",
    "formula": "1000 if t==start else V[t-1] * (1 + VolumeGrowth[t] )",
    "01-01-2023": "-",
    "01-08-2023": "-",
    "01-15-2023": "-",
    "01-22-2023": "-",
    "01-29-2023": "-",
    "02-05-2023": "-",
    "02-12-2023": "1,000",
    "02-19-2023": "1,010",
    "02-26-2023": "1,020",
    "03-05-2023": "1,030",
    "03-12-2023": "1,041",
    "03-19-2023": "1,051",
    "03-26-2023": "1,062",
    "04-02-2023": "1,072",
    "04-09-2023": "1,083",
    "04-16-2023": "1,094",
    "04-23-2023": "1,105",
    "04-30-2023": "1,116",
    "05-07-2023": "1,127",
    "05-14-2023": "1,138",
    "05-21-2023": "1,149",
    "05-28-2023": "1,161",
    "06-04-2023": "1,173",
    "06-11-2023": "1,184",
    "06-18-2023": "1,196",
    "06-25-2023": "1,208",
    "07-02-2023": "1,220",
    "07-09-2023": "1,232",
    "07-16-2023": "1,245",
    "07-23-2023": "1,257",
    "07-30-2023": "1,270",
    "08-06-2023": "1,282",
    "08-13-2023": "1,295",
    "08-20-2023": "1,308",
    "08-27-2023": "1,321",
    "09-03-2023": "1,335",
    "09-10-2023": "1,348",
    "09-17-2023": "1,361",
    "09-24-2023": "1,375",
    "10-01-2023": "1,389",
    "10-08-2023": "1,403",
    "10-15-2023": "1,417",
    "10-22-2023": "1,431",
    "10-29-2023": "1,445",
    "11-05-2023": "1,460",
    "11-12-2023": "1,474",
    "11-19-2023": "1,489",
    "11-26-2023": "1,504",
    "12-03-2023": "1,519",
    "12-10-2023": "1,534",
    "12-17-2023": "1,549",
    "12-24-2023": "1,565"
},
{
    "id": "Flow-22737",
    "parameter": "V",
    "format": "{:,.0f}",
    "source": "formula",
    "scenario": "Actuals",
    "dependencies": "-",
    "formula": "-",
    "01-01-2023": "-",
    "01-08-2023": "-",
    "01-15-2023": "-",
    "01-22-2023": "-",
    "01-29-2023": "-",
    "02-05-2023": "-",
    "02-12-2023": "-",
    "02-19-2023": "-",
    "02-26-2023": "-",
    "03-05-2023": "-",
    "03-12-2023": "-",
    "03-19-2023": "-",
    "03-26-2023": "-",
    "04-02-2023": "-",
    "04-09-2023": "-",
    "04-16-2023": "-",
    "04-23-2023": "-",
    "04-30-2023": "-",
    "05-07-2023": "-",
    "05-14-2023": "-",
    "05-21-2023": "-",
    "05-28-2023": "-",
    "06-04-2023": "-",
    "06-11-2023": "-",
    "06-18-2023": "-",
    "06-25-2023": "-",
    "07-02-2023": "-",
    "07-09-2023": "-",
    "07-16-2023": "-",
    "07-23-2023": "-",
    "07-30-2023": "-",
    "08-06-2023": "-",
    "08-13-2023": "-",
    "08-20-2023": "-",
    "08-27-2023": "-",
    "09-03-2023": "-",
    "09-10-2023": "-",
    "09-17-2023": "-",
    "09-24-2023": "-",
    "10-01-2023": "-",
    "10-08-2023": "-",
    "10-15-2023": "-",
    "10-22-2023": "-",
    "10-29-2023": "-",
    "11-05-2023": "-",
    "11-12-2023": "-",
    "11-19-2023": "-",
    "11-26-2023": "-",
    "12-03-2023": "-",
    "12-10-2023": "-",
    "12-17-2023": "-",
    "12-24-2023": "-"
},
{
    "id": "node_type",
    "parameter": "<li>Output</li>",
    "format": null,
    "scenario": null,
    "source": null,
    "dependencies": null,
    "formula": null,
    "01-01-2023": "",
    "01-08-2023": "",
    "01-15-2023": "",
    "01-22-2023": "",
    "01-29-2023": "",
    "02-05-2023": "",
    "02-12-2023": "",
    "02-19-2023": "",
    "02-26-2023": "",
    "03-05-2023": "",
    "03-12-2023": "",
    "03-19-2023": "",
    "03-26-2023": "",
    "04-02-2023": "",
    "04-09-2023": "",
    "04-16-2023": "",
    "04-23-2023": "",
    "04-30-2023": "",
    "05-07-2023": "",
    "05-14-2023": "",
    "05-21-2023": "",
    "05-28-2023": "",
    "06-04-2023": "",
    "06-11-2023": "",
    "06-18-2023": "",
    "06-25-2023": "",
    "07-02-2023": "",
    "07-09-2023": "",
    "07-16-2023": "",
    "07-23-2023": "",
    "07-30-2023": "",
    "08-06-2023": "",
    "08-13-2023": "",
    "08-20-2023": "",
    "08-27-2023": "",
    "09-03-2023": "",
    "09-10-2023": "",
    "09-17-2023": "",
    "09-24-2023": "",
    "10-01-2023": "",
    "10-08-2023": "",
    "10-15-2023": "",
    "10-22-2023": "",
    "10-29-2023": "",
    "11-05-2023": "",
    "11-12-2023": "",
    "11-19-2023": "",
    "11-26-2023": "",
    "12-03-2023": "",
    "12-10-2023": "",
    "12-17-2023": "",
    "12-24-2023": ""
},
{
    "id": "Flow-94774",
    "parameter": "R",
    "format": "{:,.0f}",
    "source": "formula",
    "scenario": "Base Case",
    "dependencies": "V, P",
    "formula": "V[t] * P[t]",
    "01-01-2023": "-",
    "01-08-2023": "-",
    "01-15-2023": "-",
    "01-22-2023": "-",
    "01-29-2023": "-",
    "02-05-2023": "-",
    "02-12-2023": "30,000",
    "02-19-2023": "30,300",
    "02-26-2023": "30,603",
    "03-05-2023": "30,909",
    "03-12-2023": "31,218",
    "03-19-2023": "31,530",
    "03-26-2023": "31,846",
    "04-02-2023": "32,164",
    "04-09-2023": "32,486",
    "04-16-2023": "32,811",
    "04-23-2023": "22,092",
    "04-30-2023": "22,313",
    "05-07-2023": "33,805",
    "05-14-2023": "34,143",
    "05-21-2023": "34,484",
    "05-28-2023": "34,829",
    "06-04-2023": "35,177",
    "06-11-2023": "35,529",
    "06-18-2023": "35,884",
    "06-25-2023": "60,405",
    "07-02-2023": "61,010",
    "07-09-2023": "61,620",
    "07-16-2023": "62,236",
    "07-23-2023": "62,858",
    "07-30-2023": "63,487",
    "08-06-2023": "76,946",
    "08-13-2023": "77,715",
    "08-20-2023": "78,493",
    "08-27-2023": "79,277",
    "09-03-2023": "80,070",
    "09-10-2023": "80,871",
    "09-17-2023": "81,680",
    "09-24-2023": "82,496",
    "10-01-2023": "97,208",
    "10-08-2023": "98,180",
    "10-15-2023": "99,162",
    "10-22-2023": "100,154",
    "10-29-2023": "101,155",
    "11-05-2023": "102,167",
    "11-12-2023": "103,189",
    "11-19-2023": "119,109",
    "11-26-2023": "120,300",
    "12-03-2023": "121,503",
    "12-10-2023": "122,718",
    "12-17-2023": "123,945",
    "12-24-2023": "125,185"
},
{
    "id": "Flow-94774",
    "parameter": "R",
    "format": "{:,.0f}",
    "source": "formula",
    "scenario": "Case 2",
    "dependencies": "V, P",
    "formula": "V[t] * P[t]",
    "01-01-2023": "-",
    "01-08-2023": "-",
    "01-15-2023": "-",
    "01-22-2023": "-",
    "01-29-2023": "-",
    "02-05-2023": "-",
    "02-12-2023": "20,000",
    "02-19-2023": "20,400",
    "02-26-2023": "20,808",
    "03-05-2023": "21,224",
    "03-12-2023": "21,649",
    "03-19-2023": "22,082",
    "03-26-2023": "33,785",
    "04-02-2023": "34,461",
    "04-09-2023": "35,150",
    "04-16-2023": "35,853",
    "04-23-2023": "36,570",
    "04-30-2023": "37,301",
    "05-07-2023": "38,047",
    "05-14-2023": "38,808",
    "05-21-2023": "39,584",
    "05-28-2023": "40,376",
    "06-04-2023": "41,184",
    "06-11-2023": "42,007",
    "06-18-2023": "42,847",
    "06-25-2023": "43,704",
    "07-02-2023": "74,297",
    "07-09-2023": "75,783",
    "07-16-2023": "77,299",
    "07-23-2023": "78,845",
    "07-30-2023": "80,422",
    "08-06-2023": "82,030",
    "08-13-2023": "83,671",
    "08-20-2023": "85,344",
    "08-27-2023": "87,051",
    "09-03-2023": "88,792",
    "09-10-2023": "90,568",
    "09-17-2023": "92,379",
    "09-24-2023": "94,227",
    "10-01-2023": "96,112",
    "10-08-2023": "98,034",
    "10-15-2023": "99,994",
    "10-22-2023": "101,994",
    "10-29-2023": "104,034",
    "11-05-2023": "42,446",
    "11-12-2023": "43,295",
    "11-19-2023": "44,161",
    "11-26-2023": "45,044",
    "12-03-2023": "45,945",
    "12-10-2023": "46,864",
    "12-17-2023": "47,801",
    "12-24-2023": "48,757"
},
{
    "id": "Flow-94774",
    "parameter": "R",
    "format": "{:,.0f}",
    "source": "formula",
    "scenario": "Flat P",
    "dependencies": "V, P",
    "formula": "V[t] * P[t]",
    "01-01-2023": "-",
    "01-08-2023": "-",
    "01-15-2023": "-",
    "01-22-2023": "-",
    "01-29-2023": "-",
    "02-05-2023": "-",
    "02-12-2023": "70,000",
    "02-19-2023": "70,700",
    "02-26-2023": "71,407",
    "03-05-2023": "72,121",
    "03-12-2023": "72,842",
    "03-19-2023": "73,571",
    "03-26-2023": "74,306",
    "04-02-2023": "75,049",
    "04-09-2023": "75,800",
    "04-16-2023": "76,558",
    "04-23-2023": "77,324",
    "04-30-2023": "78,097",
    "05-07-2023": "78,878",
    "05-14-2023": "79,667",
    "05-21-2023": "80,463",
    "05-28-2023": "81,268",
    "06-04-2023": "82,081",
    "06-11-2023": "82,901",
    "06-18-2023": "83,730",
    "06-25-2023": "84,568",
    "07-02-2023": "85,413",
    "07-09-2023": "86,267",
    "07-16-2023": "87,130",
    "07-23-2023": "88,001",
    "07-30-2023": "88,881",
    "08-06-2023": "89,770",
    "08-13-2023": "90,668",
    "08-20-2023": "91,575",
    "08-27-2023": "92,490",
    "09-03-2023": "93,415",
    "09-10-2023": "94,349",
    "09-17-2023": "95,293",
    "09-24-2023": "96,246",
    "10-01-2023": "97,208",
    "10-08-2023": "98,180",
    "10-15-2023": "99,162",
    "10-22-2023": "100,154",
    "10-29-2023": "101,155",
    "11-05-2023": "102,167",
    "11-12-2023": "103,189",
    "11-19-2023": "104,220",
    "11-26-2023": "105,263",
    "12-03-2023": "106,315",
    "12-10-2023": "107,378",
    "12-17-2023": "108,452",
    "12-24-2023": "109,537"
},
{
    "id": "Flow-94774",
    "parameter": "R",
    "format": "{:,.0f}",
    "source": "formula",
    "scenario": "Actuals",
    "dependencies": "-",
    "formula": "-",
    "01-01-2023": "-",
    "01-08-2023": "-",
    "01-15-2023": "-",
    "01-22-2023": "-",
    "01-29-2023": "-",
    "02-05-2023": "-",
    "02-12-2023": "-",
    "02-19-2023": "-",
    "02-26-2023": "-",
    "03-05-2023": "-",
    "03-12-2023": "-",
    "03-19-2023": "-",
    "03-26-2023": "-",
    "04-02-2023": "-",
    "04-09-2023": "-",
    "04-16-2023": "-",
    "04-23-2023": "-",
    "04-30-2023": "-",
    "05-07-2023": "-",
    "05-14-2023": "-",
    "05-21-2023": "-",
    "05-28-2023": "-",
    "06-04-2023": "-",
    "06-11-2023": "-",
    "06-18-2023": "-",
    "06-25-2023": "-",
    "07-02-2023": "-",
    "07-09-2023": "-",
    "07-16-2023": "-",
    "07-23-2023": "-",
    "07-30-2023": "-",
    "08-06-2023": "-",
    "08-13-2023": "-",
    "08-20-2023": "-",
    "08-27-2023": "-",
    "09-03-2023": "-",
    "09-10-2023": "-",
    "09-17-2023": "-",
    "09-24-2023": "-",
    "10-01-2023": "-",
    "10-08-2023": "-",
    "10-15-2023": "-",
    "10-22-2023": "-",
    "10-29-2023": "-",
    "11-05-2023": "-",
    "11-12-2023": "-",
    "11-19-2023": "-",
    "11-26-2023": "-",
    "12-03-2023": "-",
    "12-10-2023": "-",
    "12-17-2023": "-",
    "12-24-2023": "-"
}
]
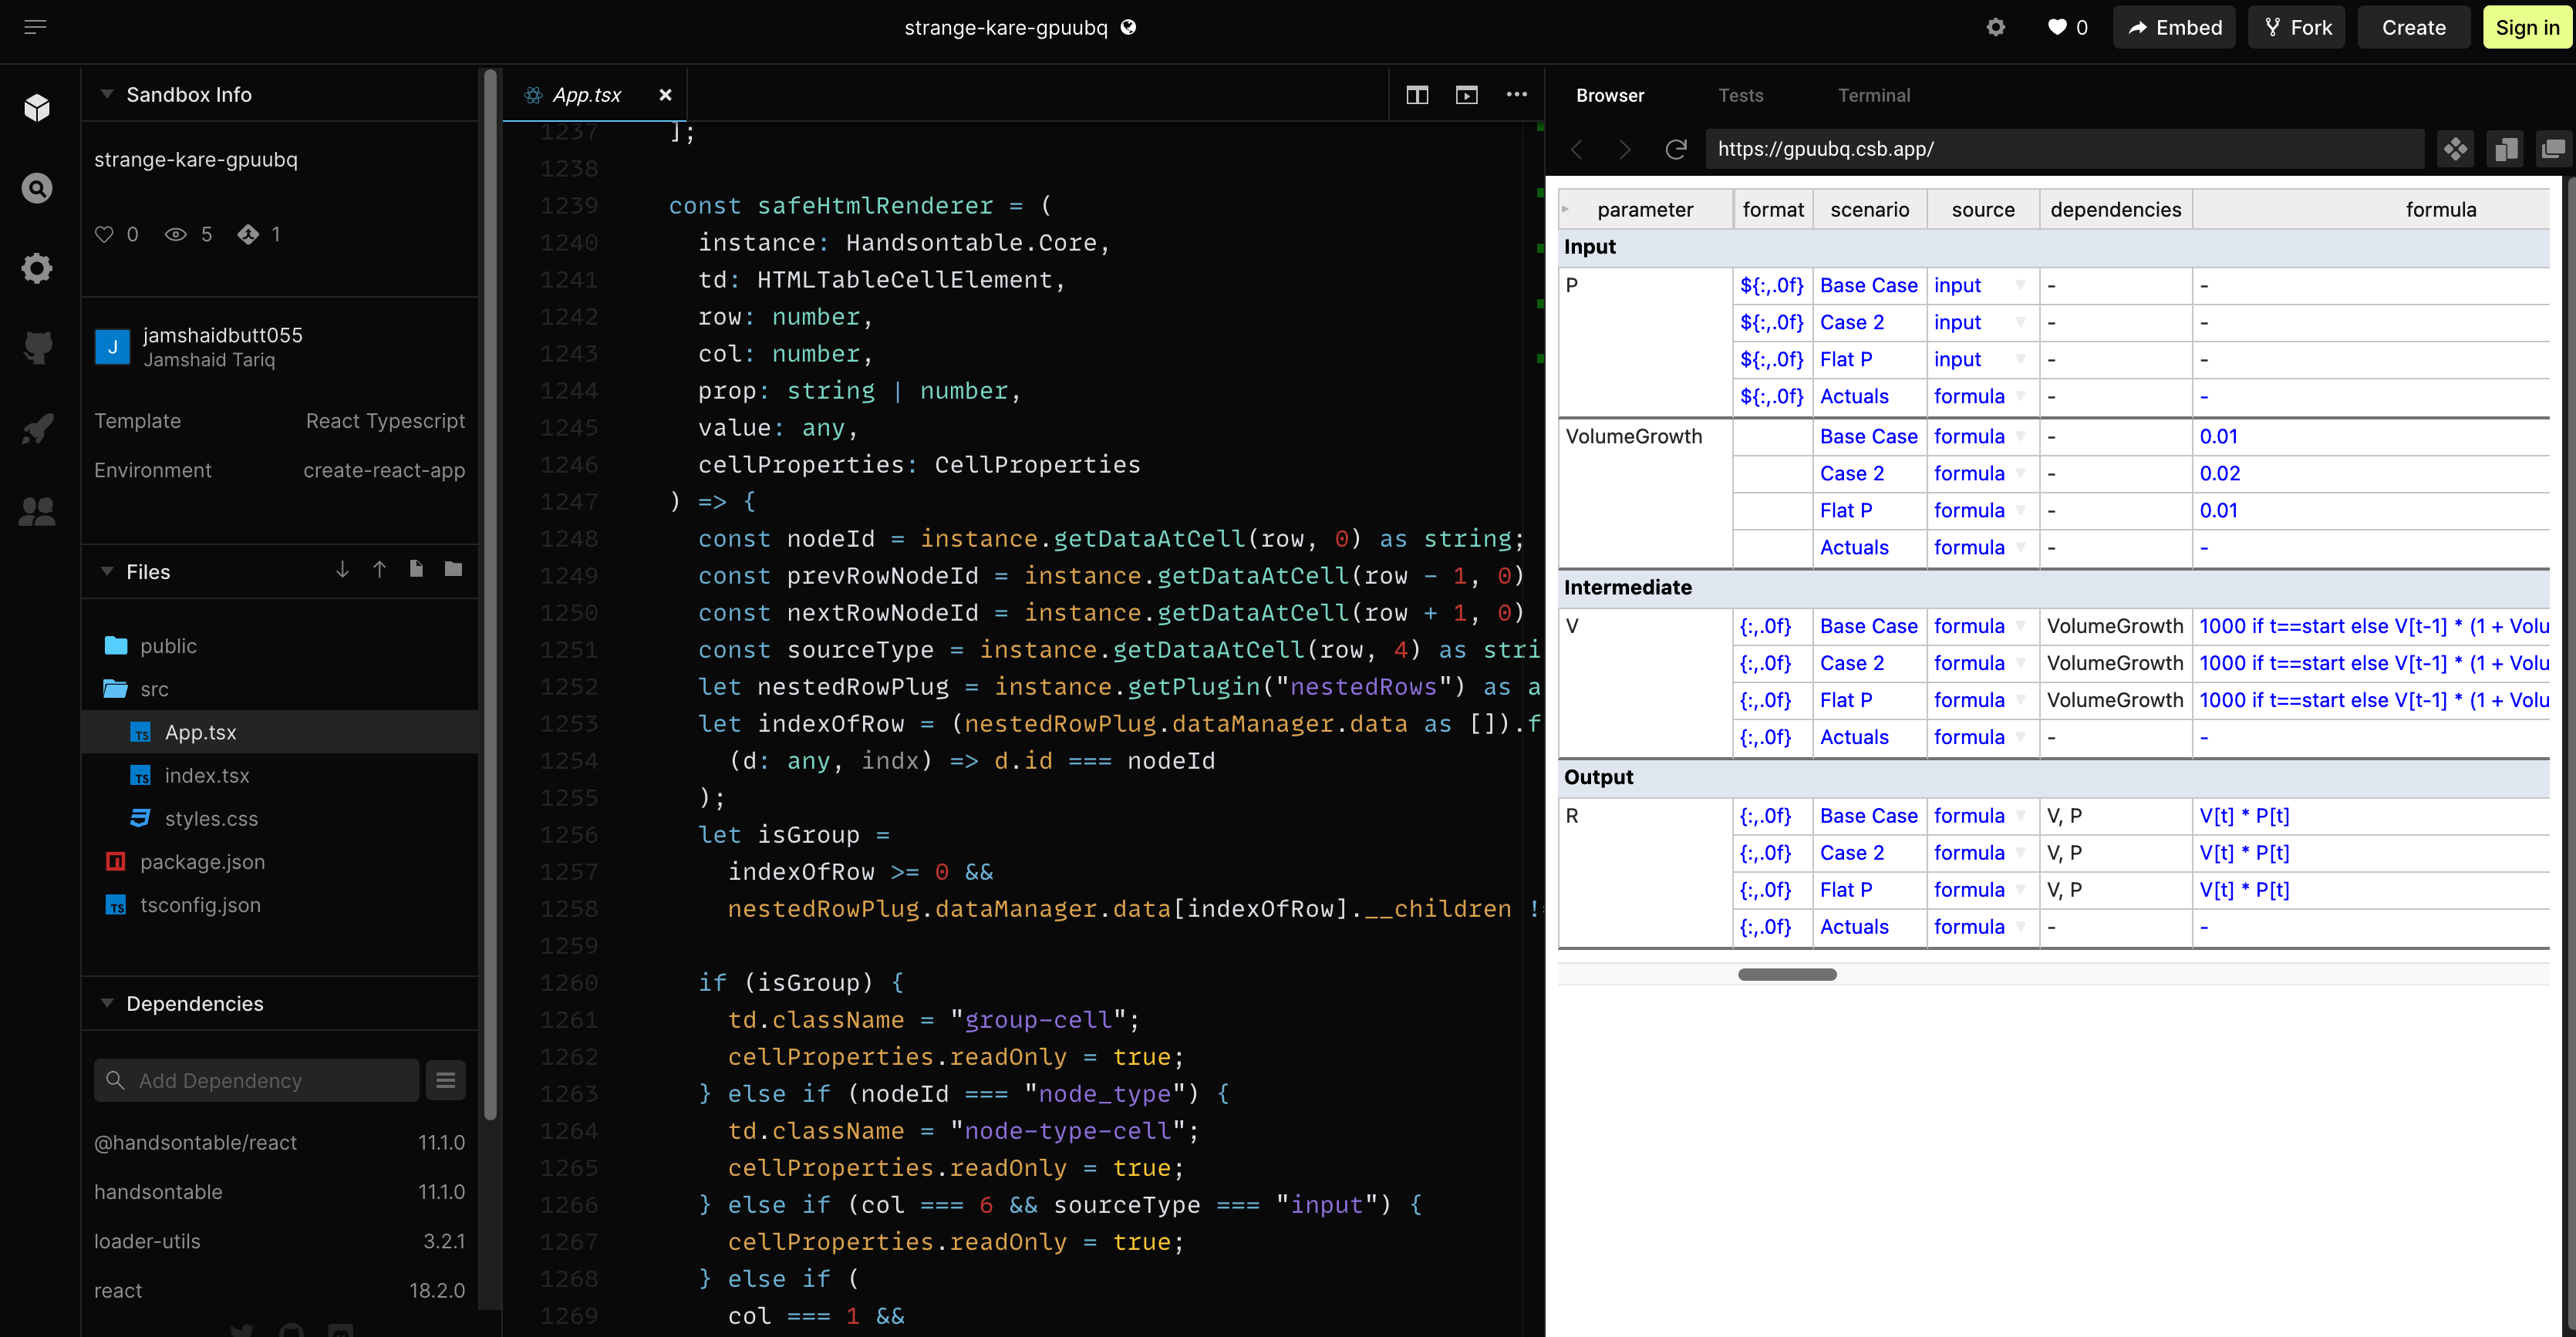
handsontable tag
<HotTable
    id="hot-model-layer"
    width="100%"
    height={
      "auto"
      // (hotRef?.current?.hotInstance?.getPlugin("nestedRows") as any)
      //   ? (hotRef!.current?.hotInstance?.getPlugin("nestedRows") as any)
      //       .dataManager.cache.rows.length > 25
      //     ? "calc(100vh - 100px)"
      //     : "auto"
      //   : "auto"
    }
    stretchH="all"
    ref={hotRef}
    data={sourceDataObject}
    fixedColumnsLeft={7}
    rowHeights="25px"
    manualColumnResize={true}
    colWidths={colWidths}
    colHeaders={headers.map((h, index) =>
      index > 6 && timeSettings.type === "year" ? h + " (Y)" : h
    )}
    nestedRows={true}
    hiddenColumns={{
      columns: hiddenColumns,
      indicators: true,
    }}
    cells={(row: number, column: number) => {
      return column !== 4
        ? {
            type: "text",
            renderer: safeHtmlRenderer,
          }
        : {
            type: "dropdown",
            source: ["formula", "input", "data"],
            renderer: safeHtmlRenderer,
          };
    }}
    contextMenu={["hidden_columns_hide", "hidden_columns_show"]}
    licenseKey="non-commercial-and-evaluation"
  />
html renderer…
export function safeHtmlRenderer(
instance: Handsontable.Core,
td: HTMLTableCellElement,
row: number,
col: number,
prop: string | number,
value: any,
cellProperties: CellProperties
) {
const nodeId = instance.getDataAtCell(row, 0) as string;
const prevRowNodeId = instance.getDataAtCell(row - 1, 0) as string;
const nextRowNodeId = instance.getDataAtCell(row + 1, 0) as string;
const sourceType = instance.getDataAtCell(row, 4) as string;
let nestedRowPlug = instance.getPlugin("nestedRows") as any;
let indexOfRow = (nestedRowPlug.dataManager.data as []).findIndex(
  (d: any, indx) => d.id === nodeId
);
let isGroup =
  indexOfRow >= 0 &&
  nestedRowPlug.dataManager.data[indexOfRow].__children !== undefined;

if (isGroup) {
  td.className = "group-cell";
  cellProperties.readOnly = true;
} else if (nodeId === "node_type") {
  td.className = "node-type-cell";
  cellProperties.readOnly = true;
} else if (col === 6 && sourceType === "input") {
  cellProperties.readOnly = true;
} else if (
  col === 1 &&
  prevRowNodeId !== nodeId &&
  nextRowNodeId === nodeId
) {
  td.className = "remove-bottom-border";
  cellProperties.readOnly = true;
} else if (
  col === 1 &&
  prevRowNodeId === nodeId &&
  nextRowNodeId === nodeId
) {
  td.className = "nodes-parameter-white remove-bottom-border";
  cellProperties.readOnly = true;
} else if (
  col === 1 &&
  nextRowNodeId !== nodeId &&
  prevRowNodeId === nodeId
) {
  td.className = "nodes-parameter-white";
  cellProperties.readOnly = true;
} else if (
  col === 2 ||
  col === 3 ||
  col === 4 ||
  col === 6 ||
  (col > 6 && sourceType === "input")
) {
  td.className = "nodes-cell-editable";
  cellProperties.readOnly = false;
} else {
  cellProperties.readOnly = true;
}
if (!isGroup && nodeId !== "node_type" && nodeId !== nextRowNodeId) {
  td.className = td.className + " bottom-border-2x";
}

if (!isGroup && nodeId !== "node_type") td.title = value;
if (col === 4 && !isGroup && nodeId !== "node_type") {
  Handsontable.renderers.AutocompleteRenderer(
    instance,
    td,
    row,
    col,
    prop,
    value,
    cellProperties
  );
} else td.innerHTML = sourceType === "input" && col === 6 ? "-" : value;
}
css classess
        .header-cell {
      color: rgb(0, 0, 0) !important;
      font-weight: bold !important;
      background: #f3f3f3 !important;
      text-align: center;
    }

    .group-cell {
      color: rgb(0, 0, 0) !important;
      font-weight: bold !important;
      background: #cbd9f5 !important;

      border-left: 0px !important;
      border-right: 0px !important;
    }

    .node-type-cell {
      color: rgb(0, 0, 0) !important;
      font-weight: bold !important;
      background: #e2e9f2 !important;
      border-left: 0px !important;
      border-right: 0px !important;
    }

    .nodes-cell-editable {
      color: rgb(0, 0, 255) !important;
    }

    .nodes-data-cell {
      color: rgb(108, 110, 112) !important;
      background: #e4eff7 !important;
    }

    .nodes-parameter-white {
      color: #fff !important;
    }
    .remove-bottom-border {
      border-bottom: 0px !important;
    }
    .bottom-border-2x {
      border-bottom: 2px solid #808080 !important;
    }

    .cell-green-20-plus {
      color: black !important;
      background: #38761dff !important;
    }

    .cell-green-10-20 {
      color: black !important;
      background: #6aa84fff !important;
    }

    .cell-green-0-10 {
      color: black !important;
      background: #93c47dff !important;
    }

    .cell-red-0-10 {
      color: black !important;
      background: #ea9999ff !important;
    }

    .cell-red-10-20 {
      color: black !important;
      background: #e06666ff !important;
    }

    .cell-red-20-plus {
      color: #fff !important;
      background: #cc0000ff !important;
    }

    .svg-container {
      contain: content !important;
    }

    .handsontable th,
    .handsontable td {
      text-overflow: ellipsis !important;
      white-space: nowrap !important;
    }