
Hello!
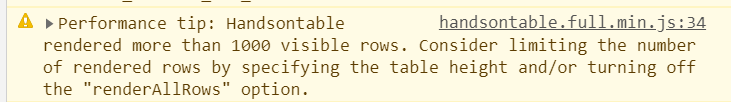
I am working in a project that handle a huge amount of rows and cols ( 4000 x 30).
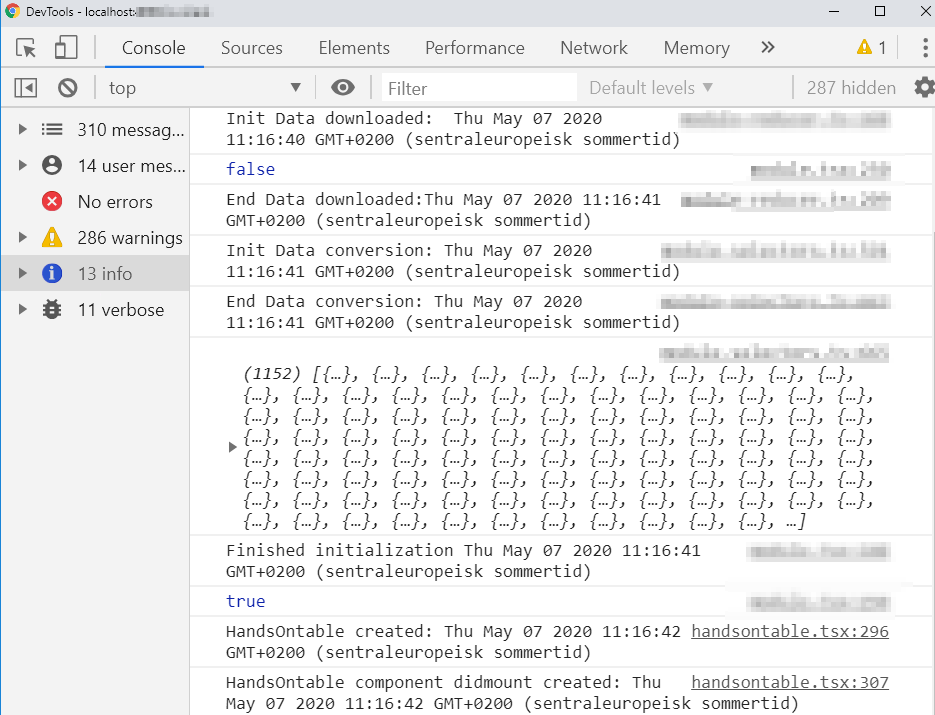
This information comes from an endpoint, the response is not taking a long time (just some milliseconds). Unfortunately, the render method is taking a long time (the loading wheel is only available for the API call, not for the render time).
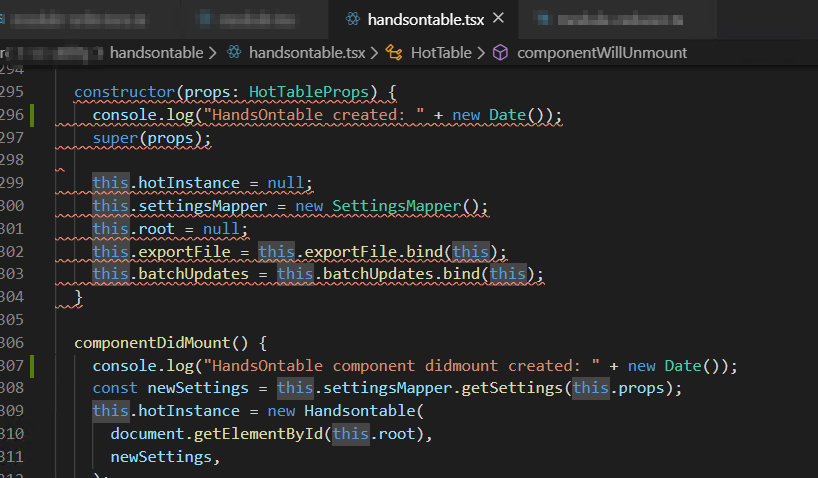
This is more or less the code 
 <HotTable
                  beforeChange={this._onChange}
                  renderAllRows={false}
                  cells={this._cellsHook}
                  fixedColumnsLeft={6}
                  exporting={this.exportButtonId}
                  root={'******'}
                  colHeaders={this._getColumnHeaders()}
                  columns={this._getColumnDefinitions()}
                  stretchH={'all'}
                  licenseKey={HANDSONTABLE_LICENSE}
                  height={this.props.tableHeight || height}
                  width={width}
                  data={this.props.rowData}

                />
On the other hand, I have updated to the latest version: 7.4.2, because I have seen that was some improvements on performance. I have to mention that after this update it is working sort of better in chrome, but a bit worst on IE (our standard browser at the moment). We upgraded from handsontable-pro:2.0.0 to handsontable:7.4.2
I have seen this topic, but the demo seems to be not working anymore: Best approach to show huge data in handsontable grid
Thank you!
Best regards,
 Thank you!