
Hi, Handsontable Team,
In HT8, Handsontable has done a lot of improvement in the performance which is a major motivation for us to upgrade to the latest version. Thanks for the work.
After upgrading to HT9, when I measure the performance, I notice that the column header seems to be rendered multiple times.
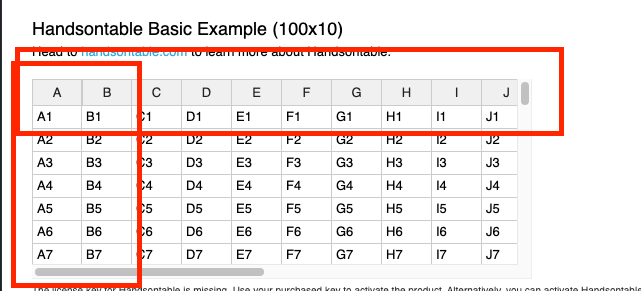
In this example: Column “A” and “B” are the left fixed columns:
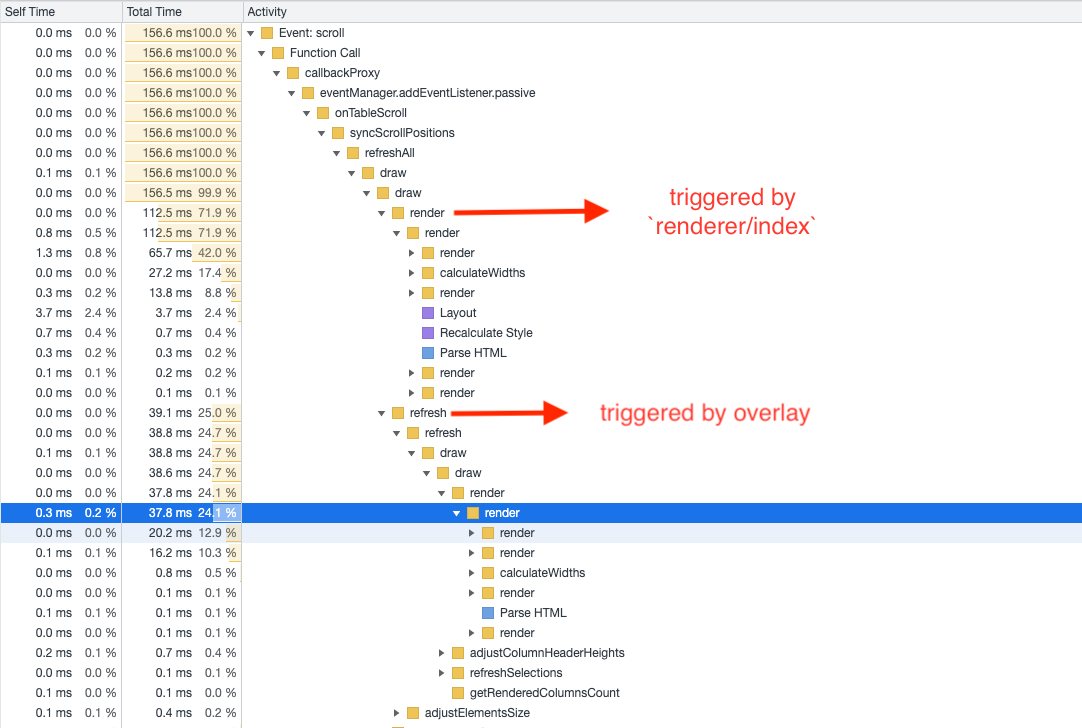
When I scroll vertically, in each onTableScroll, there are two major function triggered:
-
‘render’ function triggered by ‘renderer/index’. I believe this is for rendering the rows which is the main body of the table.
-
‘refresh’ function triggered by ‘overlays’. I think this is for rendering the overlay layer like the left fixed columns and column headers.
In our app, I placed the debugger in the appendColHeader and I noticed that:
- This function is triggered by both ‘renderer/index’ and ‘overlays’
I don’t totally understand how Handsontable rendering works. But, if the ‘overlays’ is supposed to render the column headers, why is the renderer/index also renderers them? I don’t see this overlay rendering in version 3.0.0.
This will adds about 20ms in each scroll rendering in our app. I am trying the squeeze the performance for each scroll render. Currently, after upgrade, it increase about 50ms comparing to our previous version 3.0.0
Btw, each column header is a DOM string, not a plain string.
If you think this might be something we did incorrectly in our app, let me know.
Thanks so much.