We are working on a resource forecasting tool, the use case is provided below (you may find the sample excel attached)
- A Project Manager can add a project to the spreadsheet by clicking on a button in the HTML page.
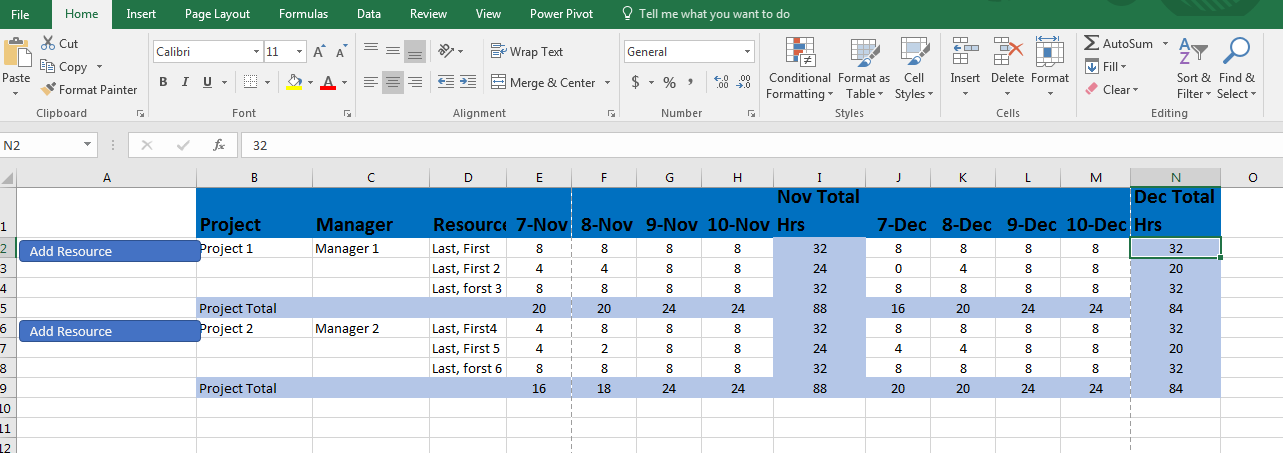
- When a project is inserted, the first column should have a button ‘Add Resource’
- The PM can now add resources under the project by clicking on the ‘Add Resource’ button. A new row is created each time the button is clicked.
- The project hours forecasted for each resource will be entered in the spreadsheet (column E-H, J-M)
- The spreadsheet will have a summary row/column to list the Project total Hours (row 5 and 9) as well as the Resource total (column I and N in the attachment)
- The subtotal row/column should be updated whenever the PM add time or delete time (or resource) from the sheet
- PM can add multiple projects and repeat the steps 1-6
Could you please advise on the possible implementation options with Handsontable (we are looking at Pro version)